Boxplots
A boxplots is used to display the distribution of a quantitative variable.
Boxplot Using a Dataset
# Data comes from the mtcars dataset
boxplot(mtcars$mpg, col="orange", main="Distribution of Gas Mileage", ylab="Miles per Gallon") 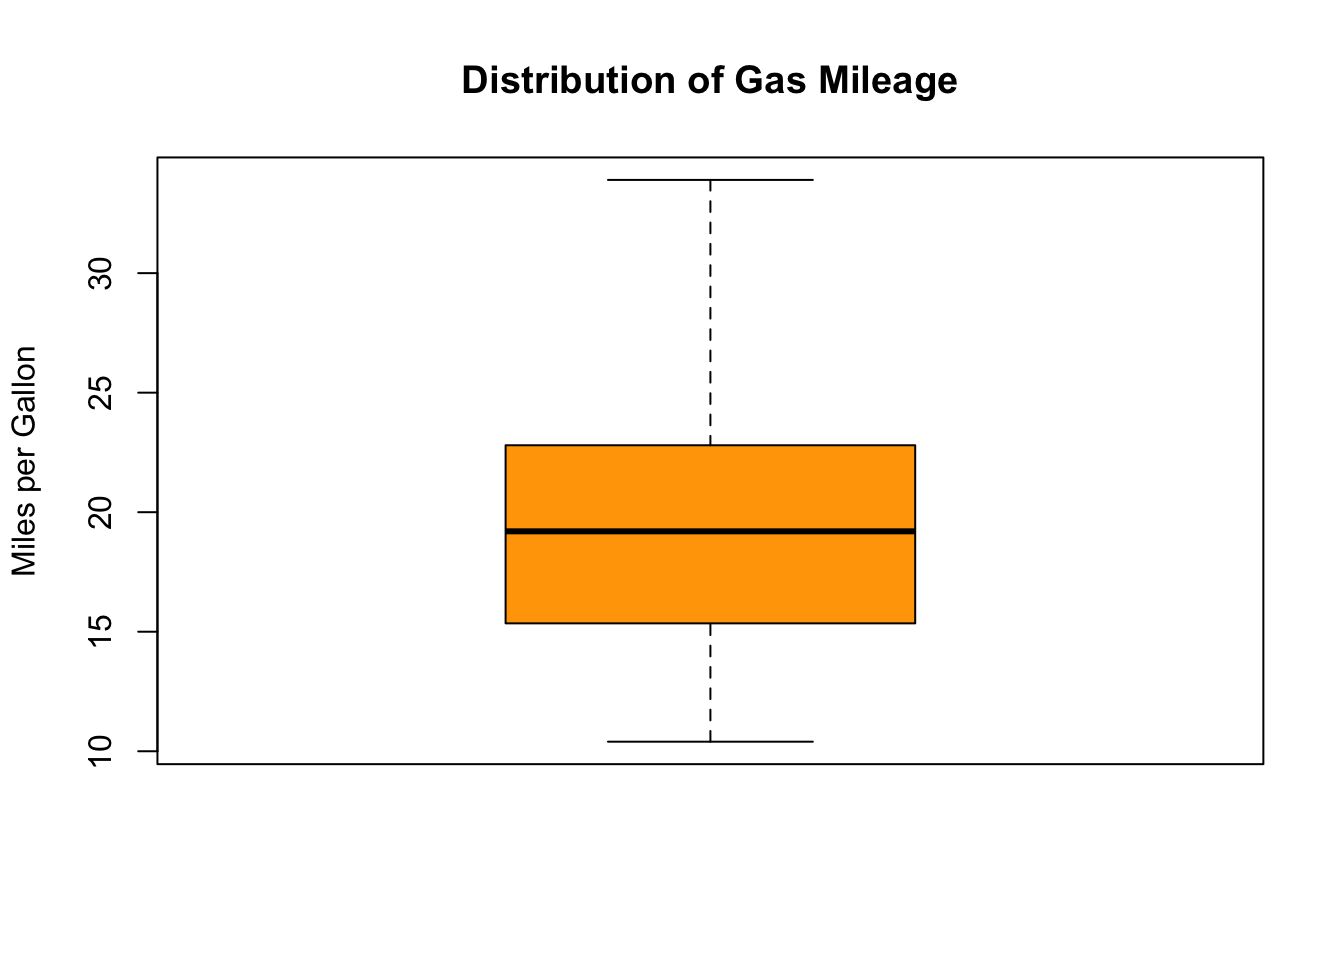
Horizontal Boxplot
You can rotate this plot by adding the horizontal=TRUE argument to the boxplot() function (shown below).
# Data comes from the mtcars datasets.
boxplot(mtcars$mpg, col="orange", main="Distribution of Gas Mileage", xlab="Miles per Gallon", horizontal=TRUE) 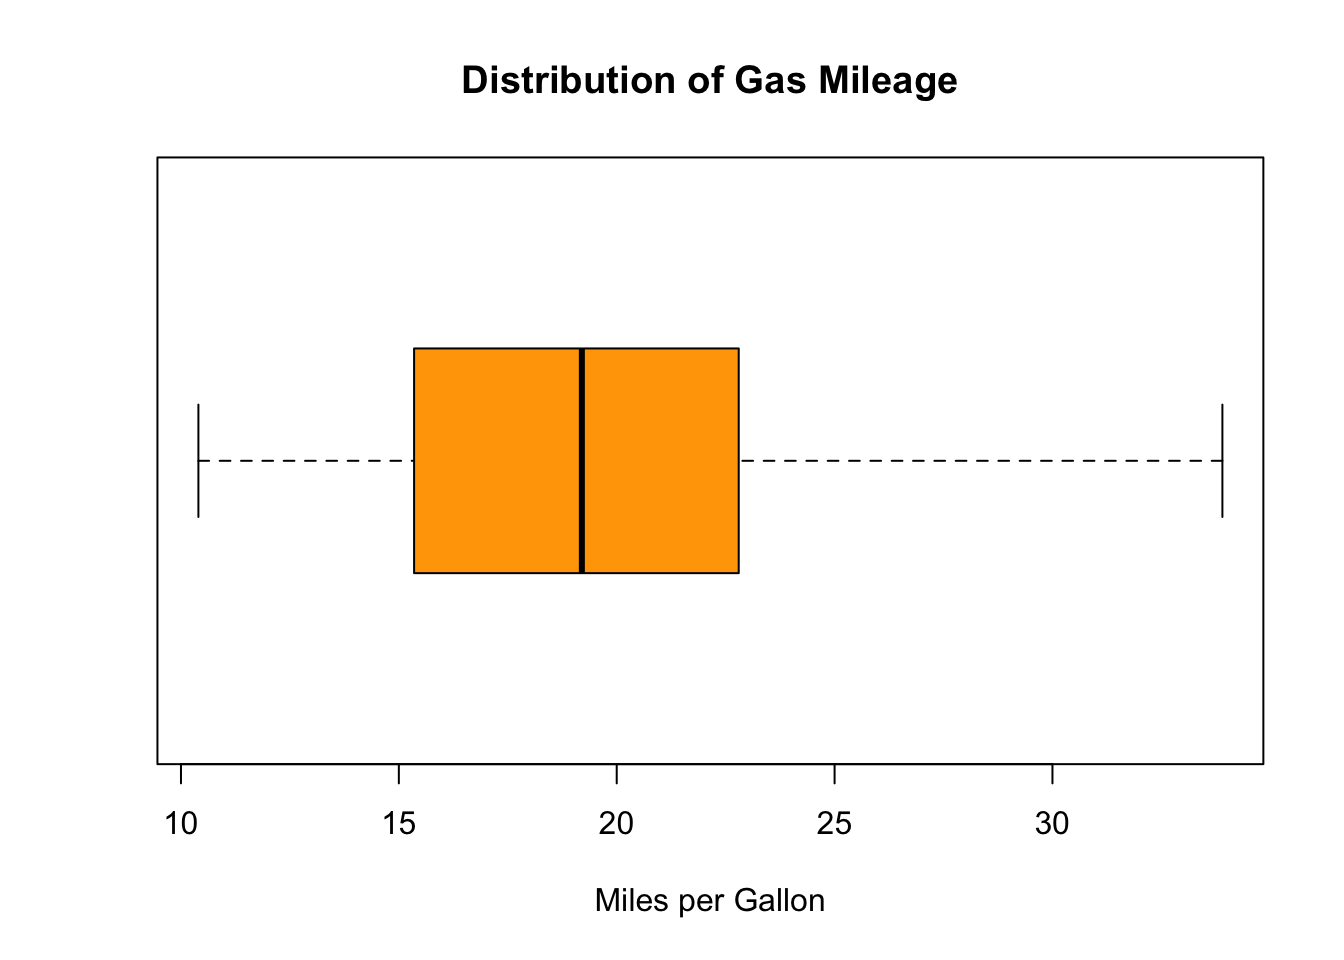
Boxplot Using Your Own Data
startup <- c(23, 4, 29,44,47,24,40,23,23,44,33,27, 60, 41, 61, 11, 23, 62, 31, 44, 77, 14, 65, 42);
boxplot(startup, col="violet", main="Distribution of Start-Up Times for Businesses Around the World", ylab="Days") 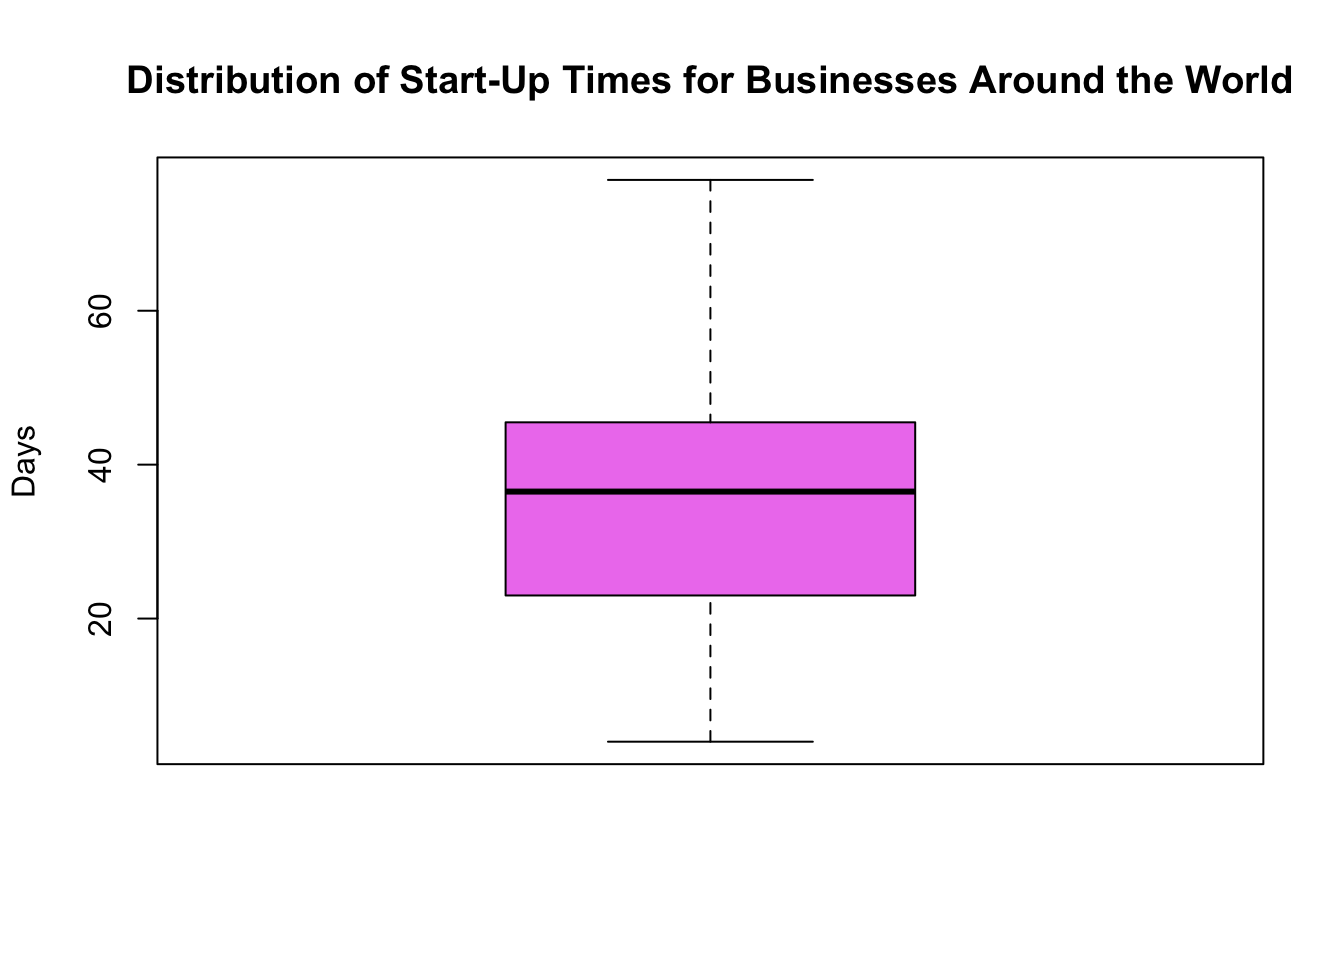
Mathematicss, Computer Science, and Statistics Department Gustavus Adolphus College