Multiple Plots
Multiple graphs can be displayed on the same plot to show trends and relationships in a data set. In particular these plots may be useful in identifying outliers.
Matrix of Plots
# 4 figures plotted in 2 rows and 2 columns
par(mfrow=c(2,2)) # mfrow=c(2,2) creates a 2 row by 2 column pannel of plots
hist(mtcars$wt,main="Distribution of Weithg", xlab="Weight (1000 lbs)", col="purple")
boxplot(mtcars$wt,main="Distribution of Weithg", xlab="Weight (1000 lbs)", col="purple", horizontal = TRUE)
hist(mtcars$mpg,main="Distribution of Gas Milage", xlab="Miles per Gallon", col="plum")
boxplot(mtcars$mpg,main="Distribution of Gas Milage", xlab="Miles per Gallon", col="plum", horizontal = TRUE)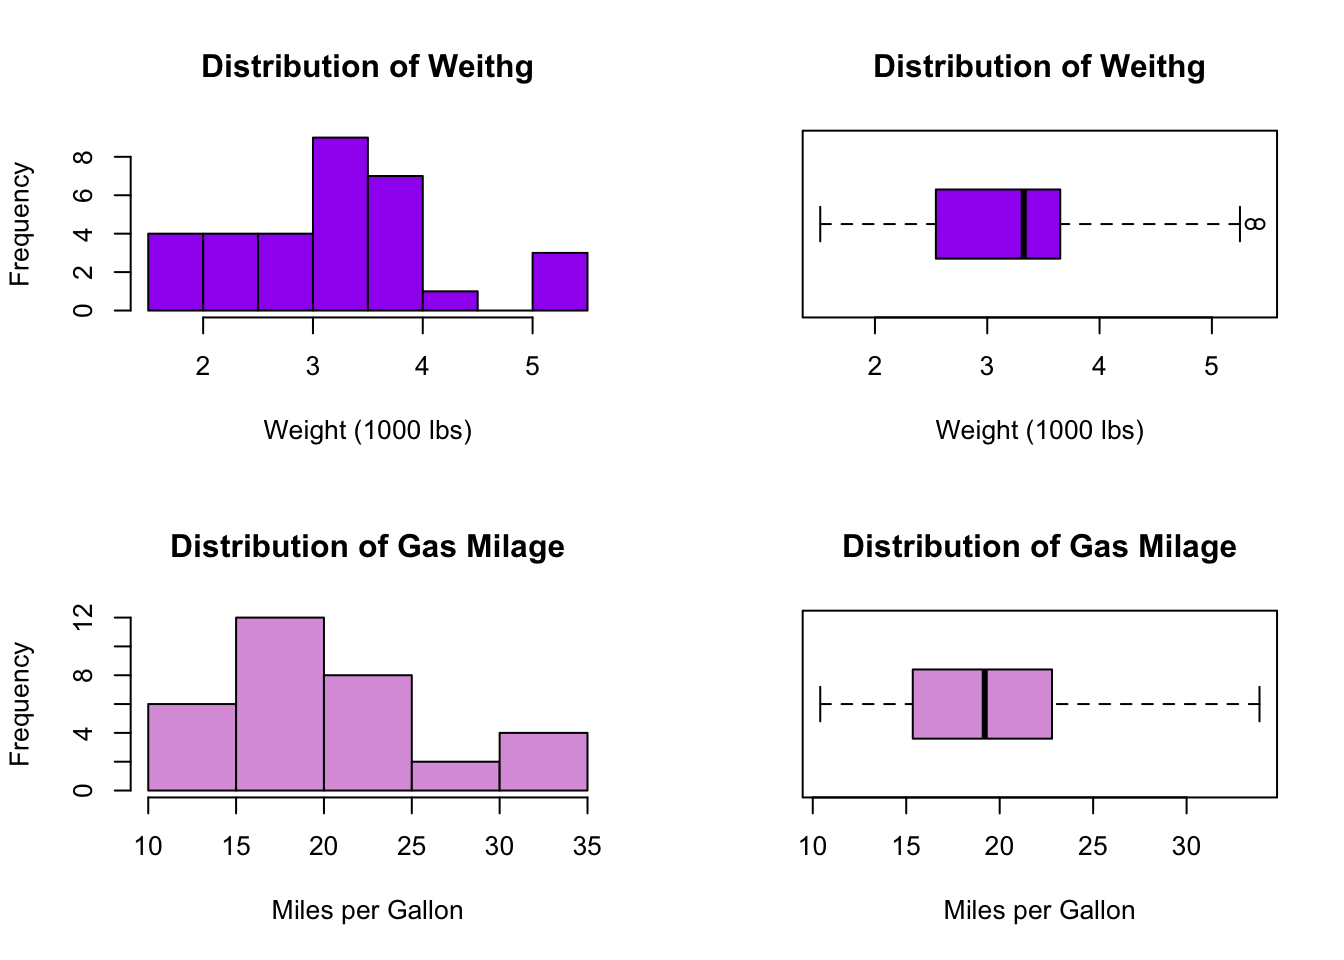
Scatterplot with Boxpllts
# Add boxplots to a scatterplot
par(fig=c(0,.8,0,0.8)) # fig() adjusts the plot's width, height, and  location
plot(mtcars$wt, mtcars$mpg, xlab="Car Weight",
  ylab="MPG", pch=19, bty="n")
par(fig=c(.7,1,0,0.8),new=TRUE)
boxplot(mtcars$mpg, axes=FALSE, pch=19)
par(fig=c(0,.8,.5,.95), new=TRUE)
boxplot(mtcars$wt, axes=FALSE, pch=19, horizontal=TRUE)
mtext("Scatterplot with Boxplots", outer=TRUE, side=3, line=-3)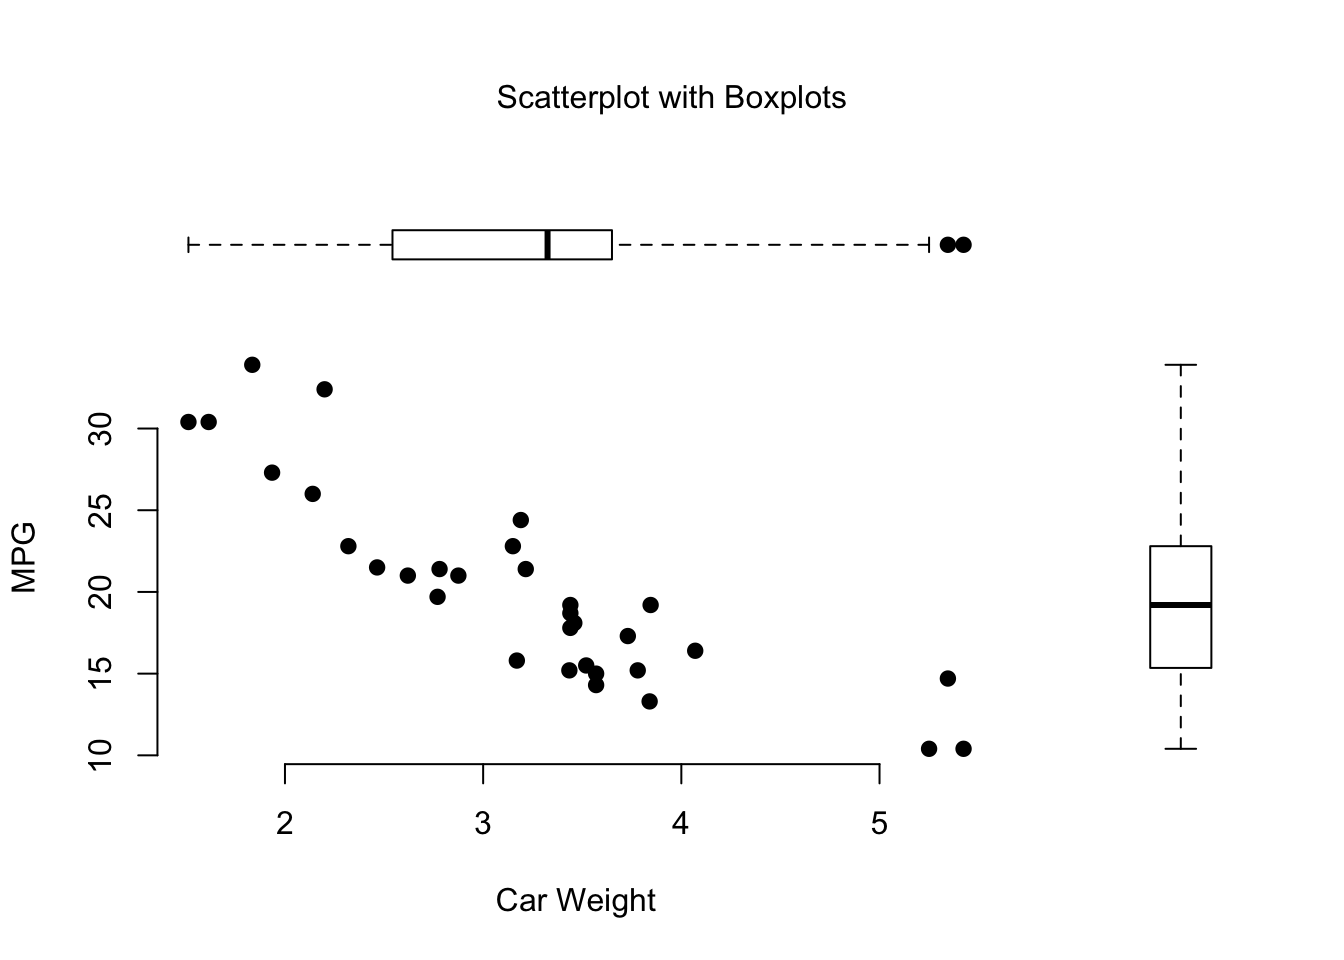
Mathematicss, Computer Science, and Statistics Department Gustavus Adolphus College