Side-By-Side Boxplots
Side-By-Side boxplots are used to display the distribution of several quantitative variables or a single quantitative variable along with a categorical variable.
Side-By-Side Boxplots Using a Dataset
# Data comes from the mtcars dataset
boxplot(mtcars$mpg ~ mtcars$gear, col="orange", main="Distribution of Gas Mileage", ylab="Miles per Gallon", xlab="Number of Gears") 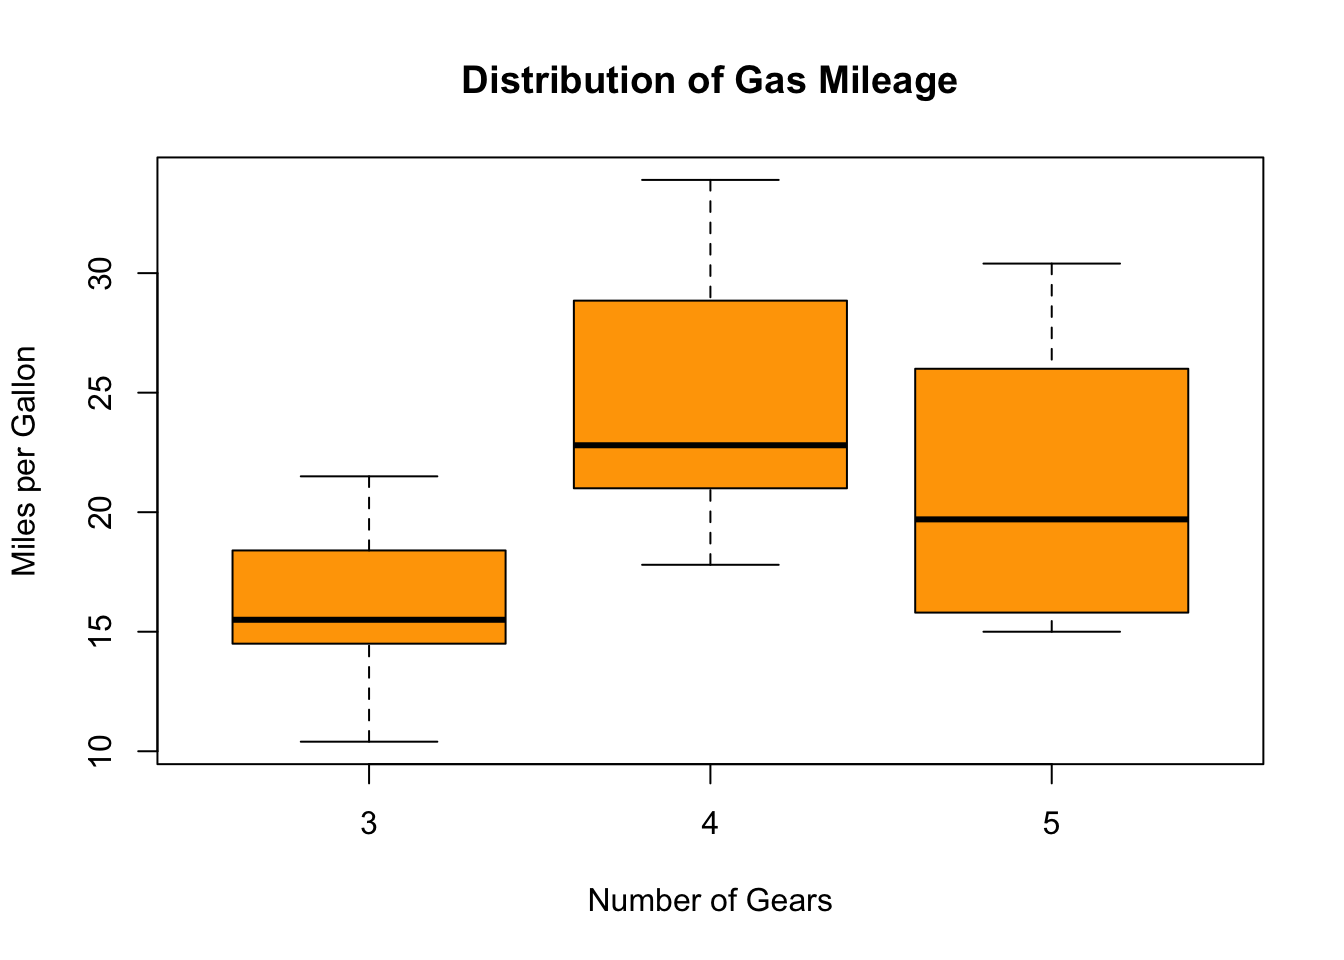
Side-By-Side Horizontal Boxplots
# Data comes from the mtcars datasets.
boxplot(mtcars$mpg ~ mtcars$gear, col="violet", main="Distribution of Gas Mileage", xlab="Miles per Gallon", ylab="Number of Gears", horizontal=TRUE) 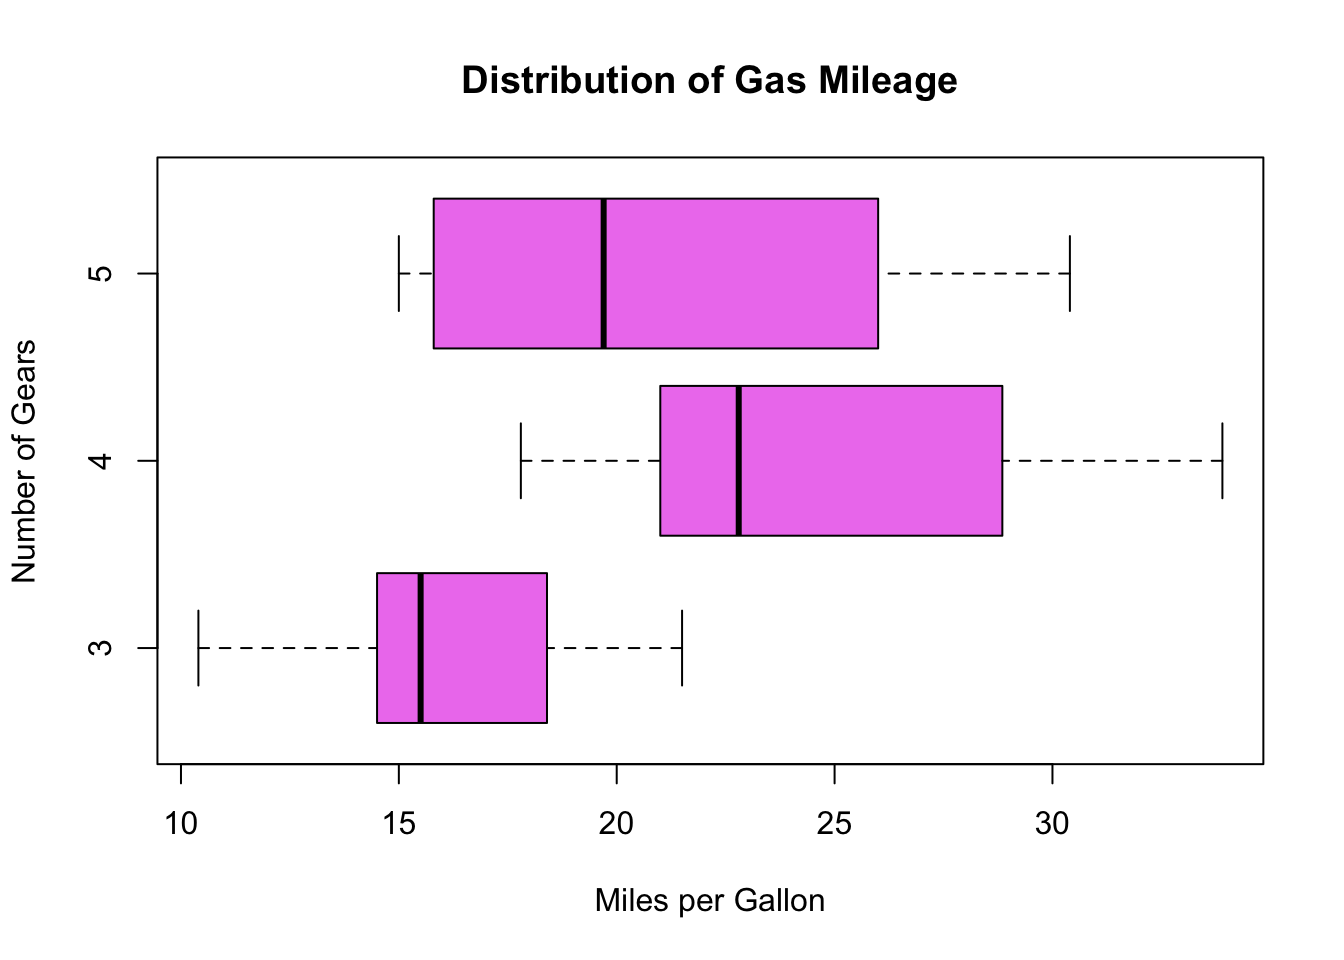
Side-By-Side Boxplots ggplot2
library(ggplot2)
mtcars$gear <- factor(mtcars$gear) # converts gear to a categorical variable
my.bp <<-ggplot(data=mtcars, aes(y= mpg, x=gear, fill=gear ) ) # Creates boxplots
my.bp <- my.bp + geom_boxplot() # Adds color
my.bp <- my.bp + ggtitle("Distribution of Gas Mileage") # Adds a title
my.bp <- my.bp +  ylab("Miles per Gallon") + xlab("Number of Gears") # Adds kaveks
my.bp # displays the boxplots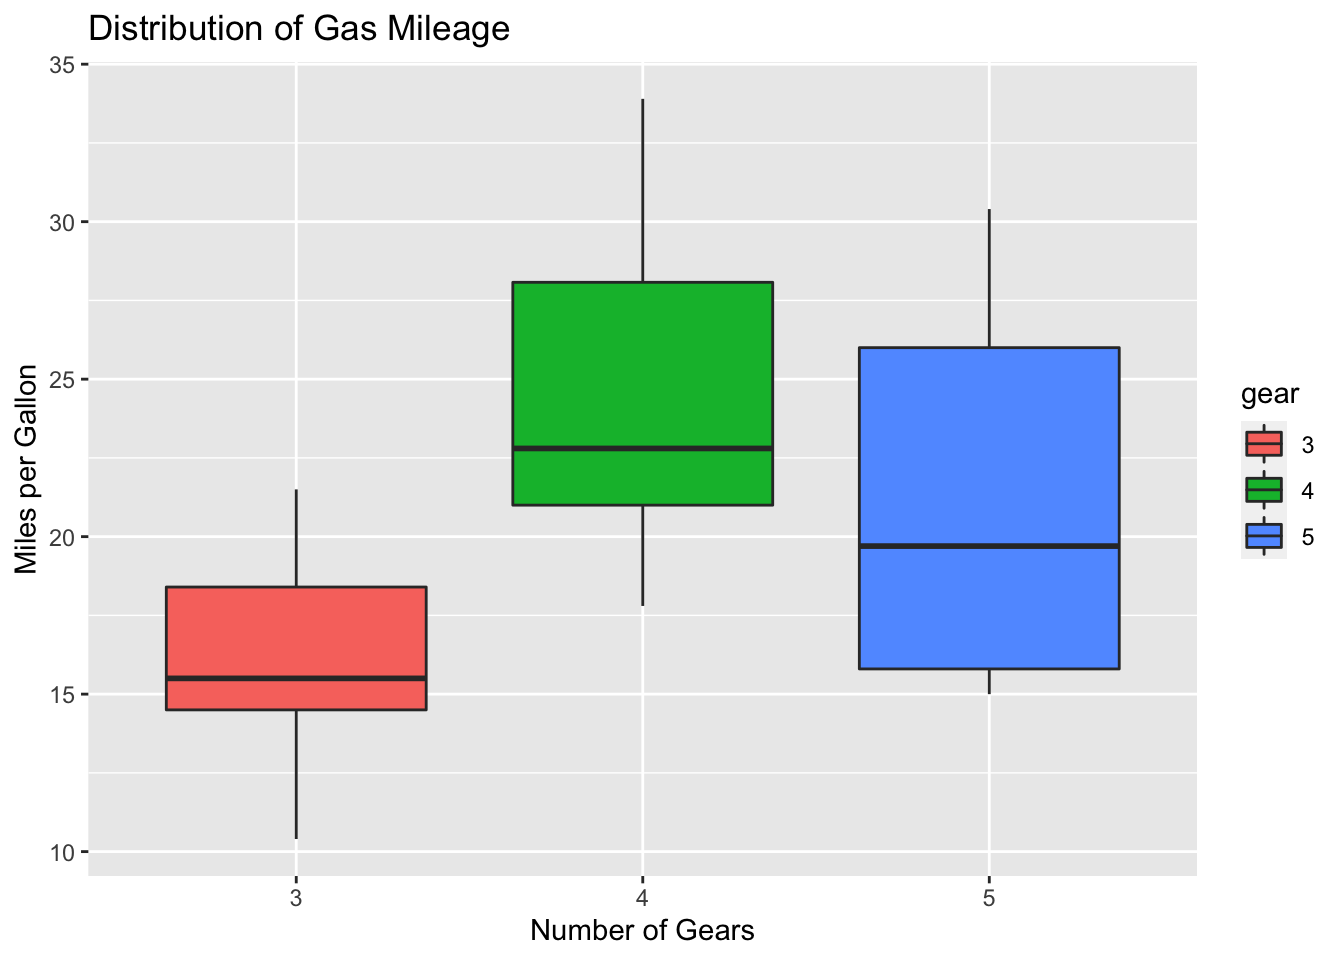
Side-By-Side Horizontal Boxplot Using ggplot2
You can rotate the previously created plot by adding the coord_flip() arguement.
my.bp <- my.bp + coord_flip() # rotates the boxplot
my.bp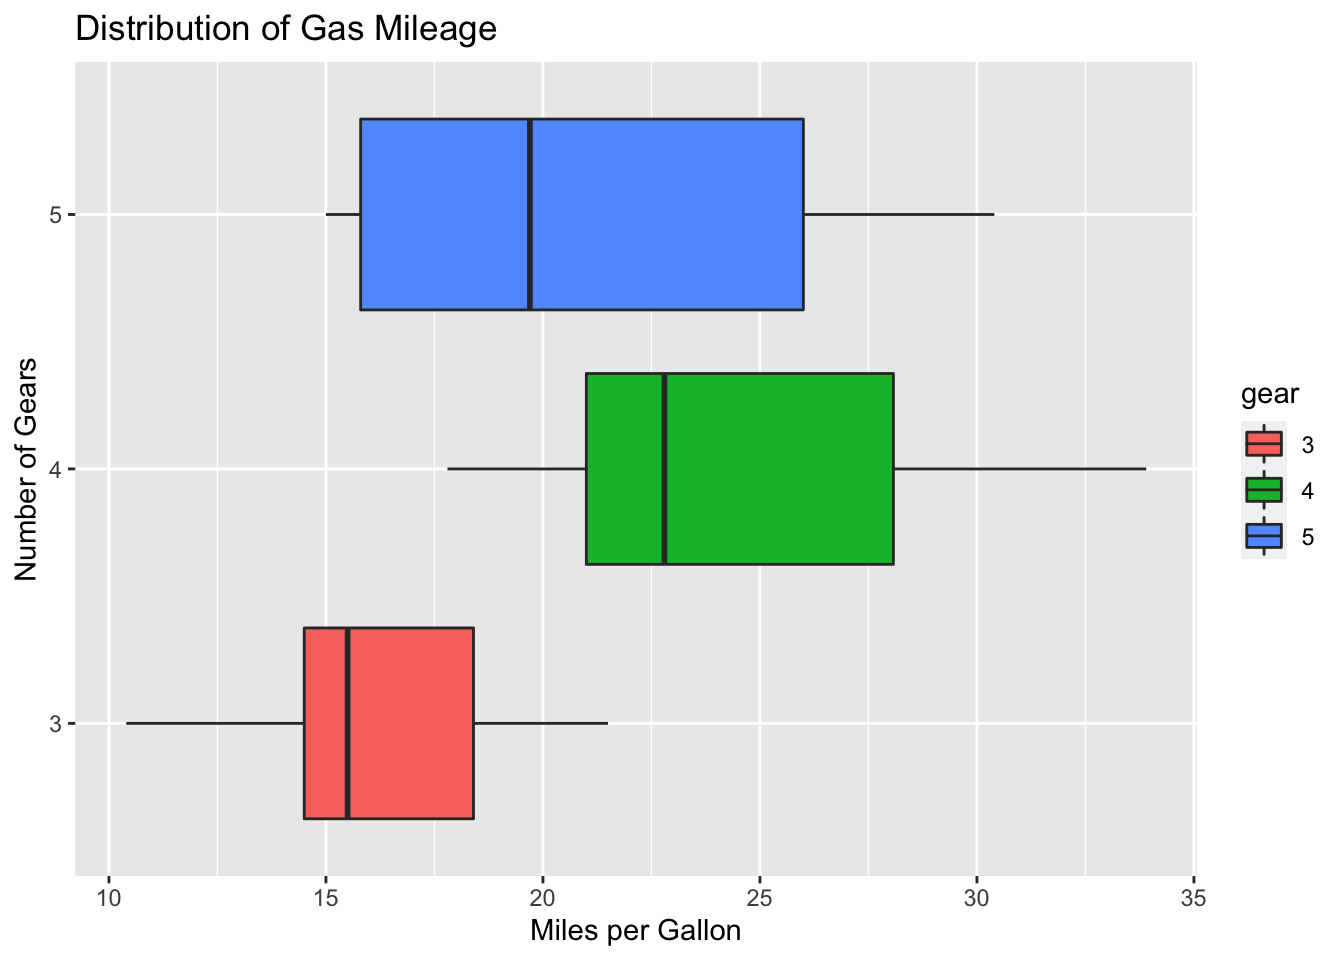
Mathematicss, Computer Science, and Statistics Department Gustavus Adolphus College