Mosaic Plots
Mosaic plots are used to display the distribution of two categorical variables. These plots look very similar to a stacked side-by-side bar chart.
Mosaic Plot
The example below uses the ggplot2,
ggmosaic and the dplyr packages to construct a
mosaic plot of automobile class and drive train for dat stored in the
mpg dataset.
library(ggplot2) # Loads the ggplot2 library
library(ggmosaic) # Loads the mosaic plot library
library(dplyr) # loads the dplyr library for cleaning data
The plot below displays the distribution of drive train within each
level of automobile class. The width of each bar is determined by the
number of observations within each level of class.
 mpg %>%
  count(class, drv) %>% # creates a frequency table
  ggplot() +
    geom_mosaic(aes(x = product(class), fill = drv, weight = n)) +
    labs(
      title = "Drive Train within Automobile Class",
      x = "Gear",
      y = ""
) 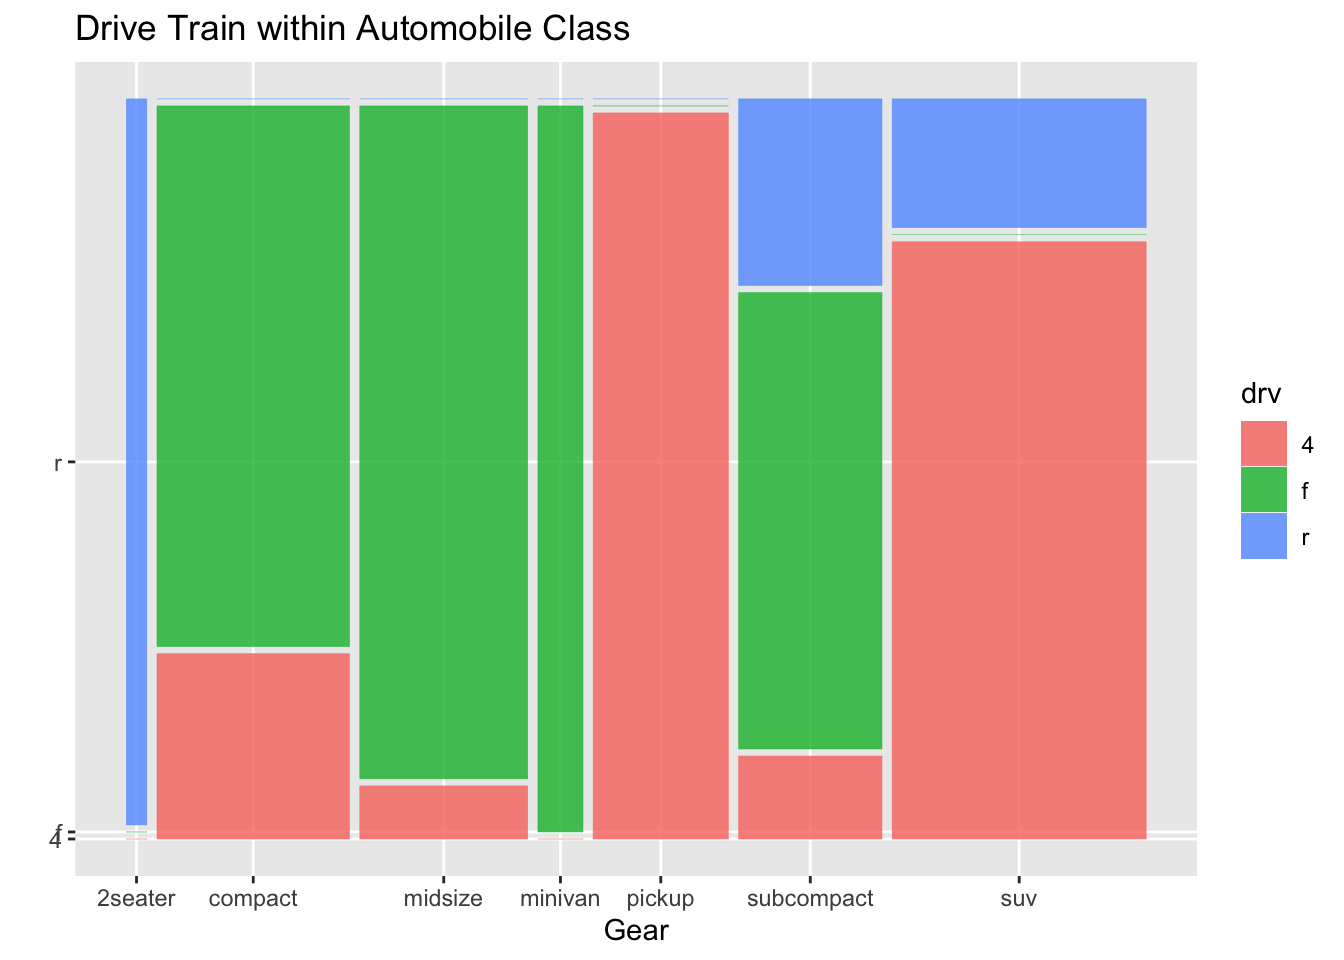
It is easy to see that the mpg data set contains very
few cars that are 2 seaters.
Mathematicss, Computer Science, and Statistics Department Gustavus Adolphus College