The t Distribution
t Density Curve
The following code will generate a t density curve with 20 degrees of freedom.
curve(dt(x, df=20), main="t Distribution", xlab="t", ylab="density", type="l", xlim=c(-4,4) );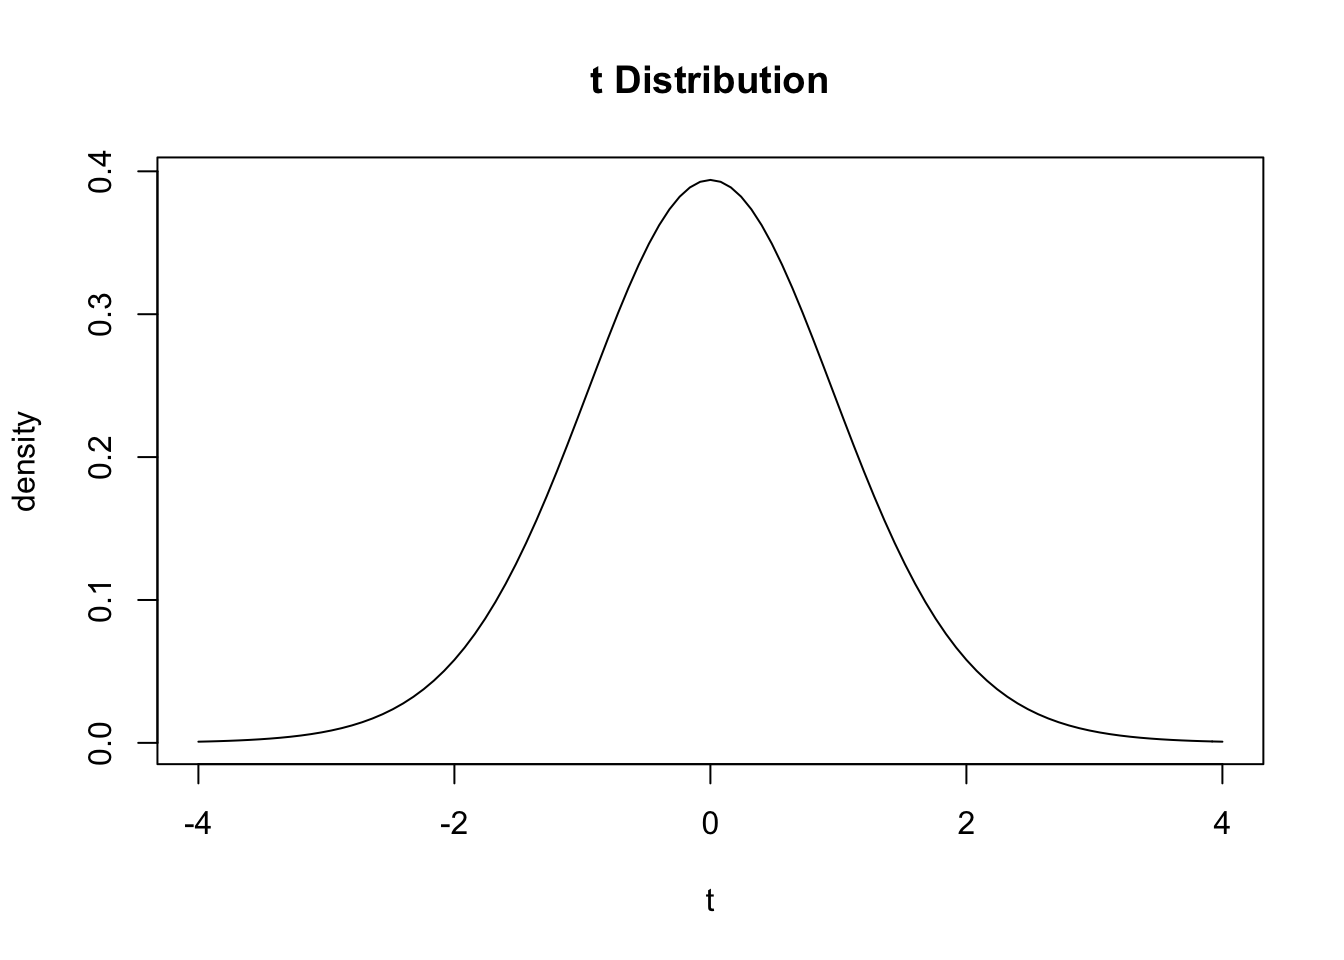
Calculating Probabilities Using the t Distribution
The following will calculate the probability for a t-statistic, q = 1.23, with 20 degrees of freedom.
pt(q=1.23, df=20); # for P(T ≤ q)## [1] 0.8835151pt(q=1.23, df=20, lower.tail=FALSE); # for P(T ≥ q)## [1] 0.1164849Calculating t Scores
The following will calculate the t-statistic, t, with 20 degrees of freedom for a specified probability p.
qt(p = .85, df = 20); # for P(T ≤ q) = p## [1] 1.064016qt(p = .85, df = 20, lower.tail=FALSE); # for P(T ≥ 1) = p## [1] -1.064016Mathematicss, Computer Science, and Statistics Department Gustavus Adolphus College