Empirical Cumulative Distribution Function
eCDF
The Empirical Cumulative Distribution Function is used to examine a distribution.
A Single Group
Below is the code used to create an ecdf using the mpg variable from the the mtcars dataset.
library(dplyr)
library(ggplot2)

mtcars %>%
  ggplot(aes(x = mpg)) +
    stat_ecdf(geom = "point")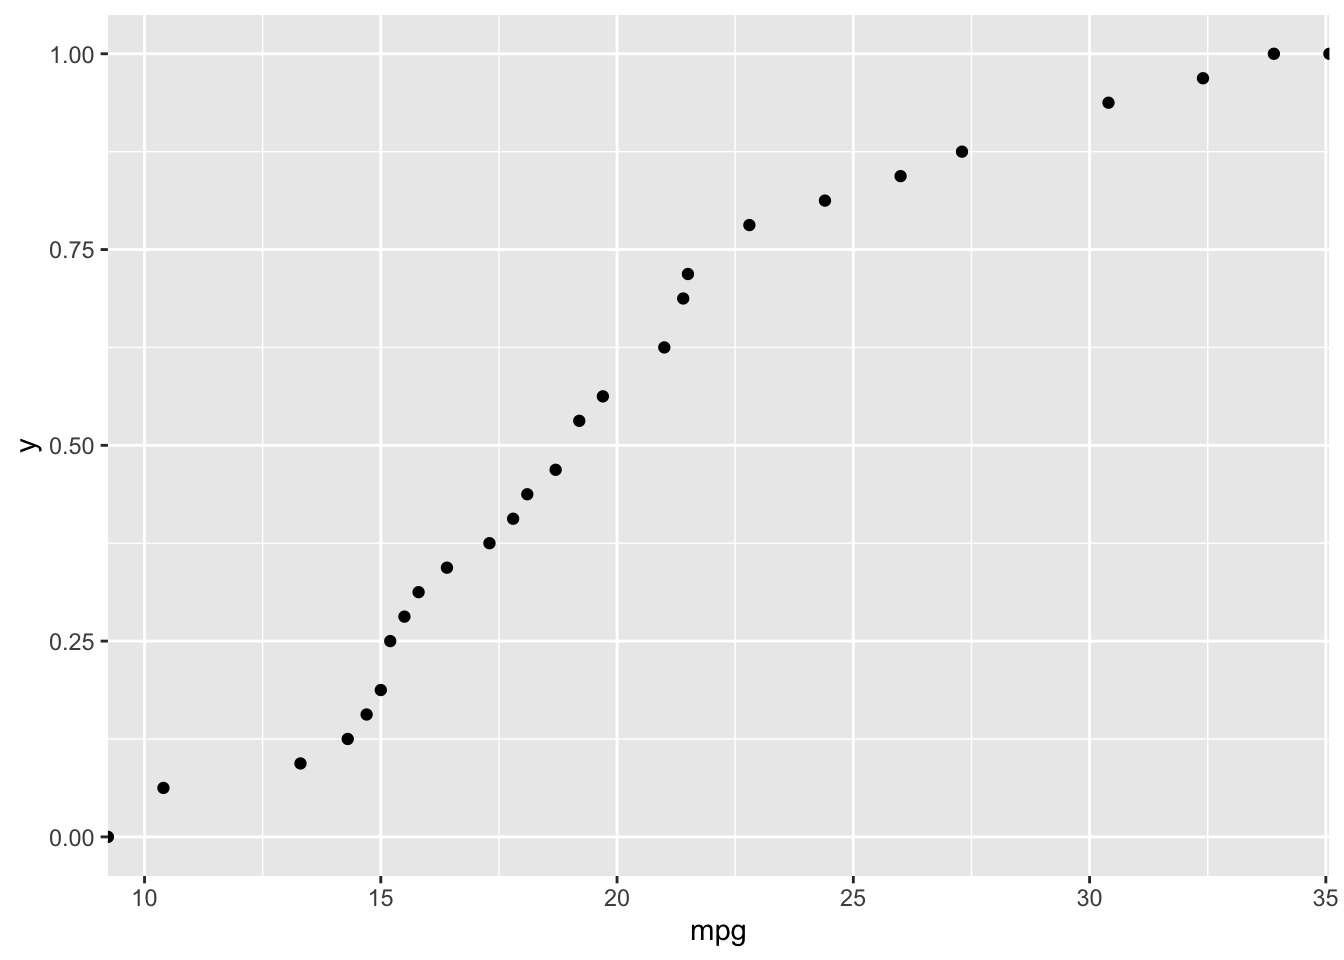
The step option in the stat_ecdf() function adds lines to the points.
mtcars %>%
  ggplot(aes(x = mpg)) +
    stat_ecdf(geom = "step")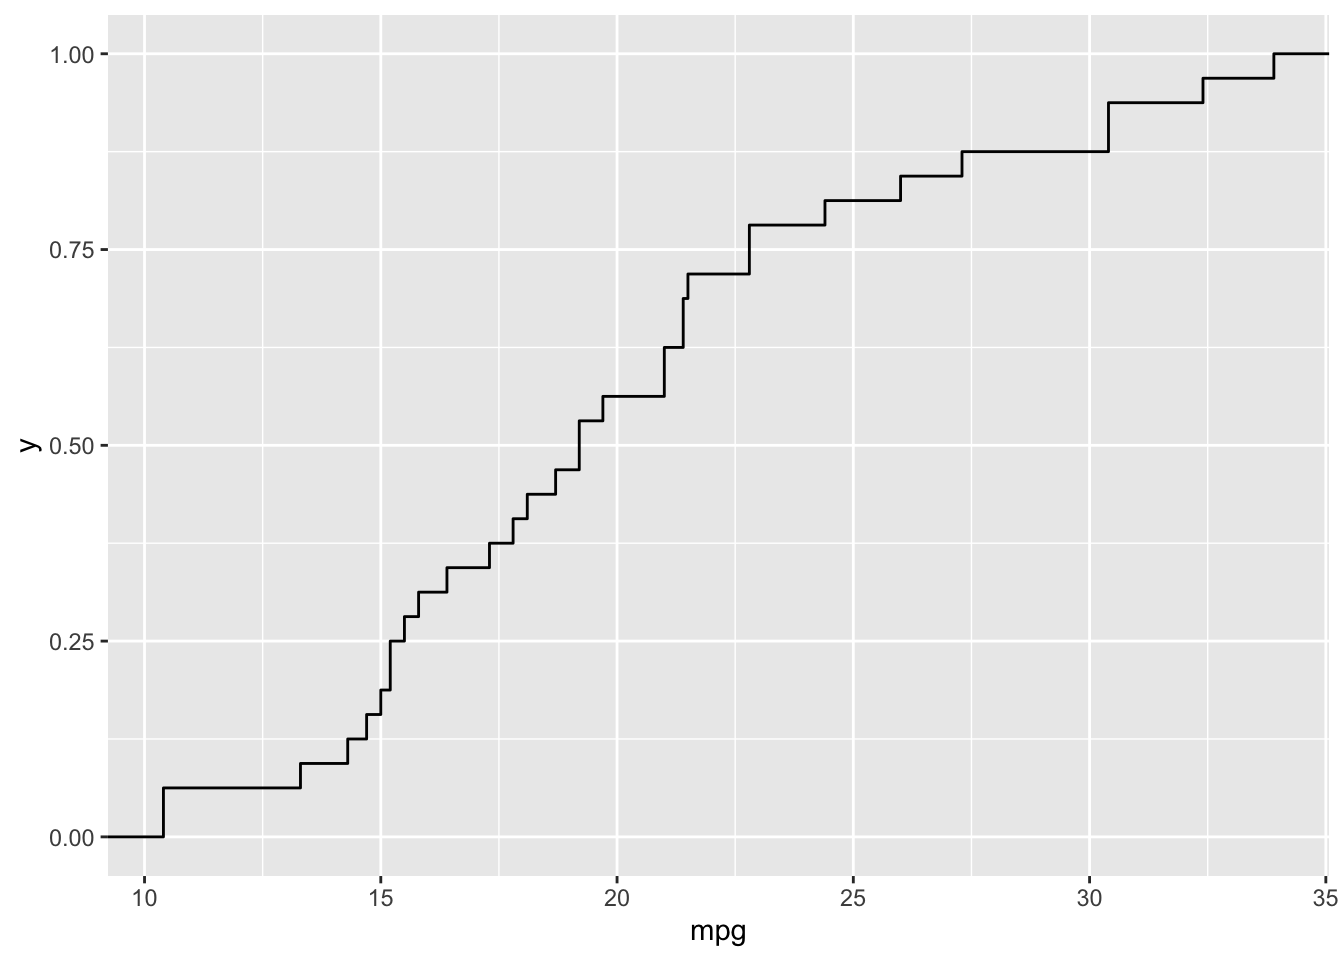
Multiple Groups
Below is the code used to create an ecdf using the mpg separated by transmission type, am. This will generate an ecdf for each m group
library(dplyr)
library(ggplot2)

mtcars <- mtcars %>% mutate( am = factor(am, labels=c("Automatic", "Manual")))

mtcars %>%
  ggplot(aes(x = mpg, group = am, shape = am)) +
    stat_ecdf(geom = "point") +
    scale_shape_discrete(name  ="Transmission")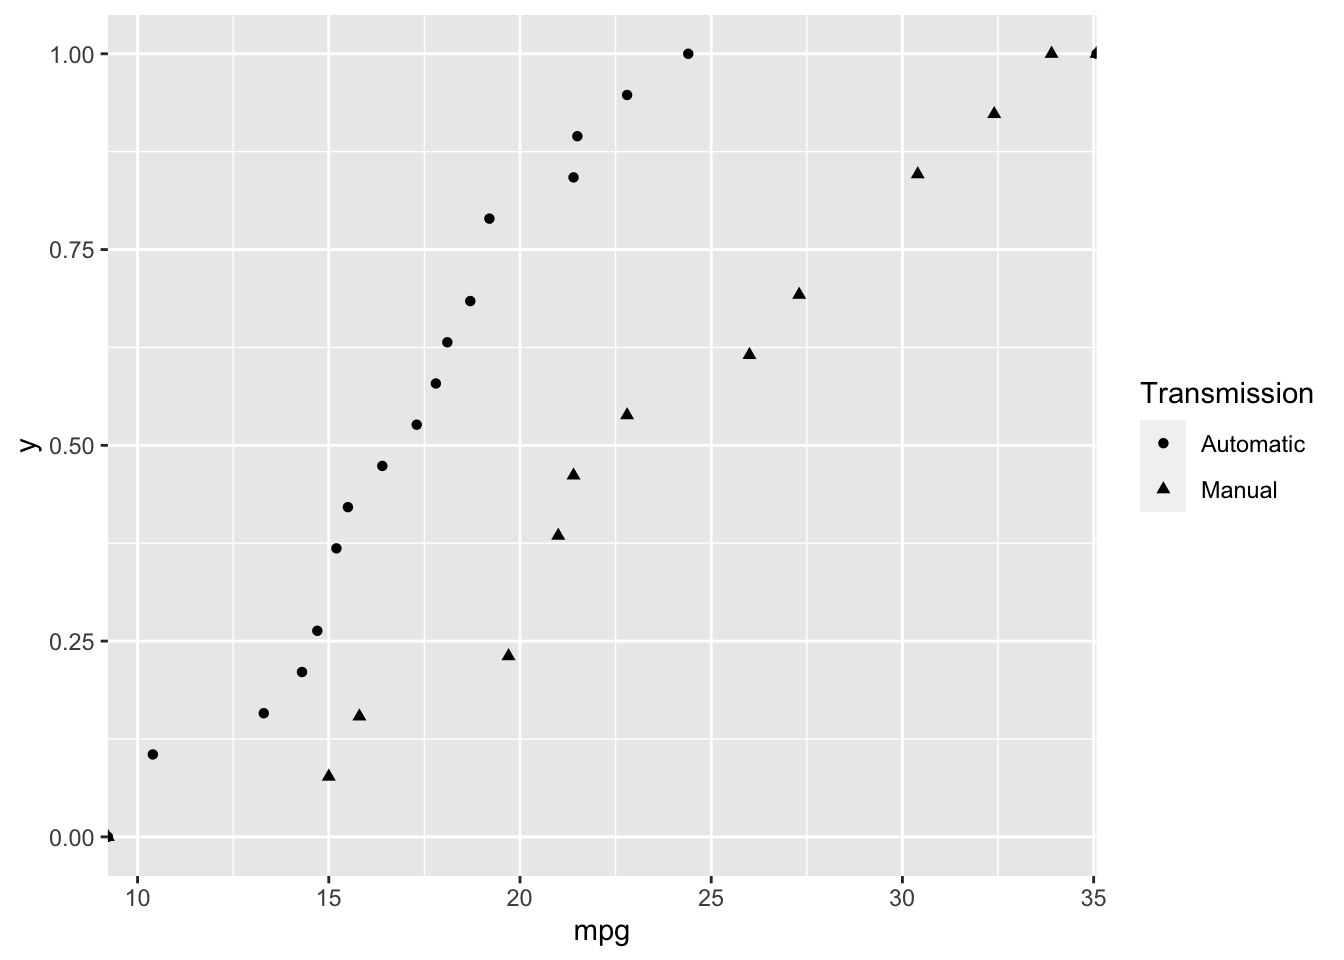
Mathematicss, Computer Science, and Statistics Department Gustavus Adolphus College