Boxplots
Boxplots are used to display the distribution of a single quantitative variable.
A Simple Boxplot
The code below uses the mtcars dataset and creates a boxplot of gas mileage. The code also includes a title and labels for the x and y axes.
library(ggplot2) # Loads the ggplot2 package

bx <- ggplot(data = mtcars, aes(y = mpg)) +
  geom_boxplot(fill ="blue") +
  ggtitle("Distribution of Miles per Gallon") +
  ylab("MPG") +
  xlab("")
bx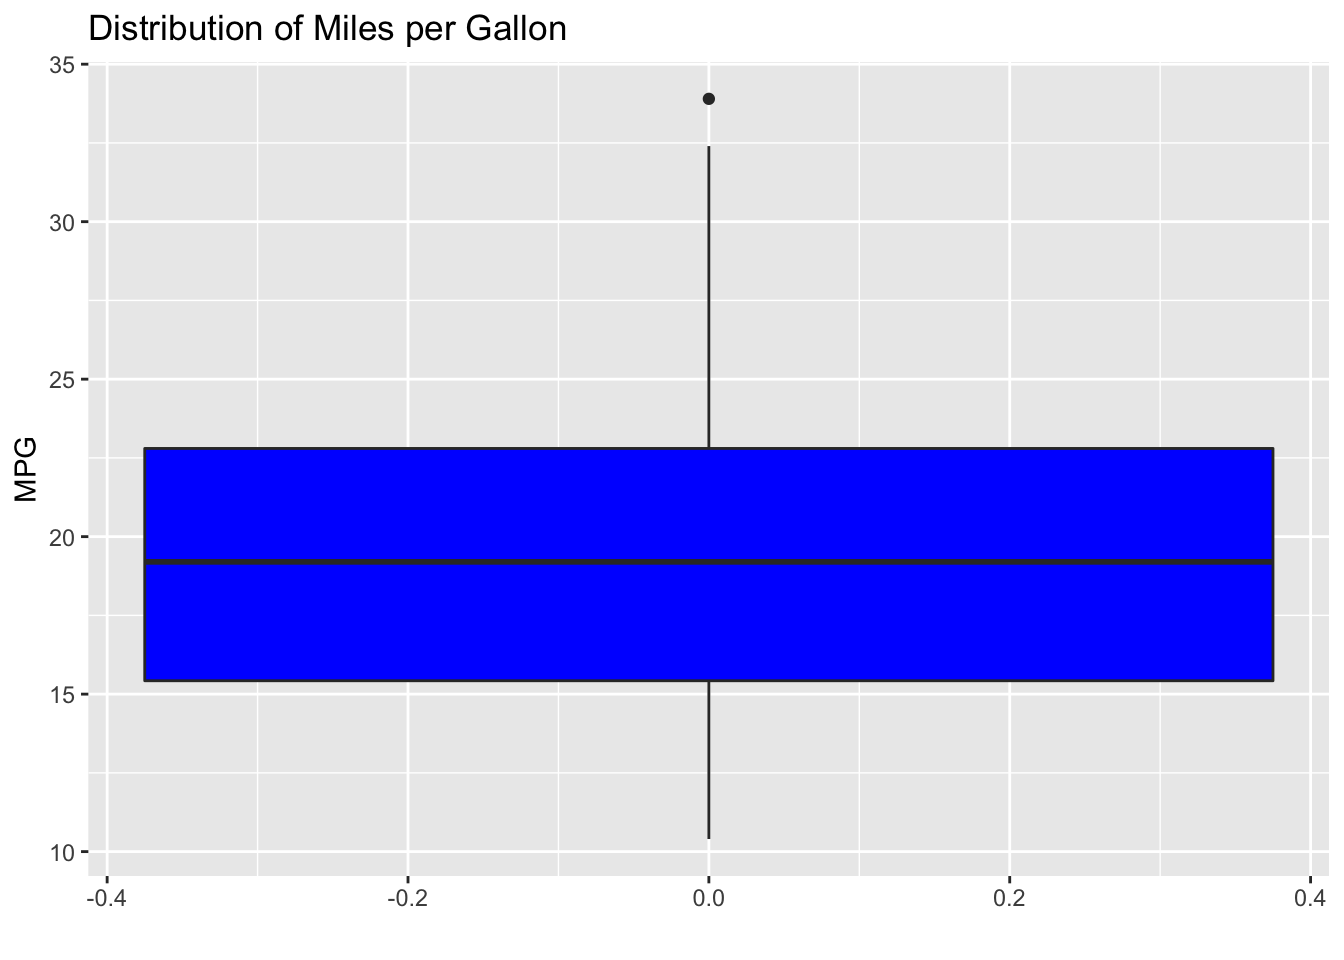
Horizontal Boxplot
Adding the coord_flip() function to the boxplot that was created above rotates the previously created boxplot by \(90 ^\circ\).
bx + coord_flip()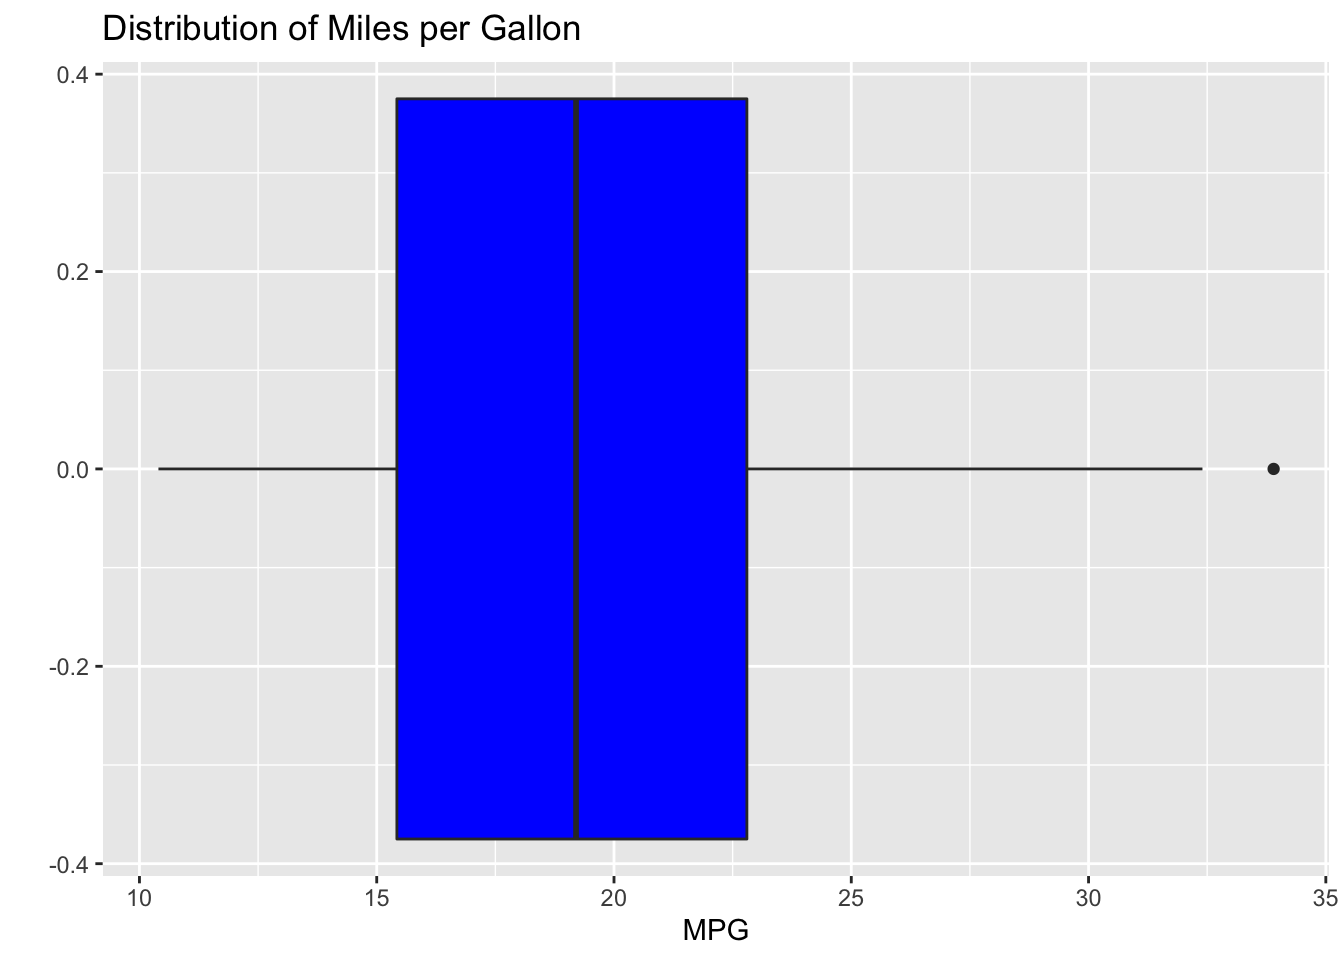
Side By Side Boxplots
Side-by-Side boxplots are used to display the distribution of a quantitative response variable and a categorical explanatory variable. The example below displays the distribution of gas mileage based on the number of cylinders.
bx <- ggplot(data = mtcars, aes(x = factor(cyl), y = mpg )) +
  geom_boxplot(fill = "blue") +
  ggtitle("Distribution of Gas Mileage") +
  ylab("MPG") +
  xlab("Cylinders")
bx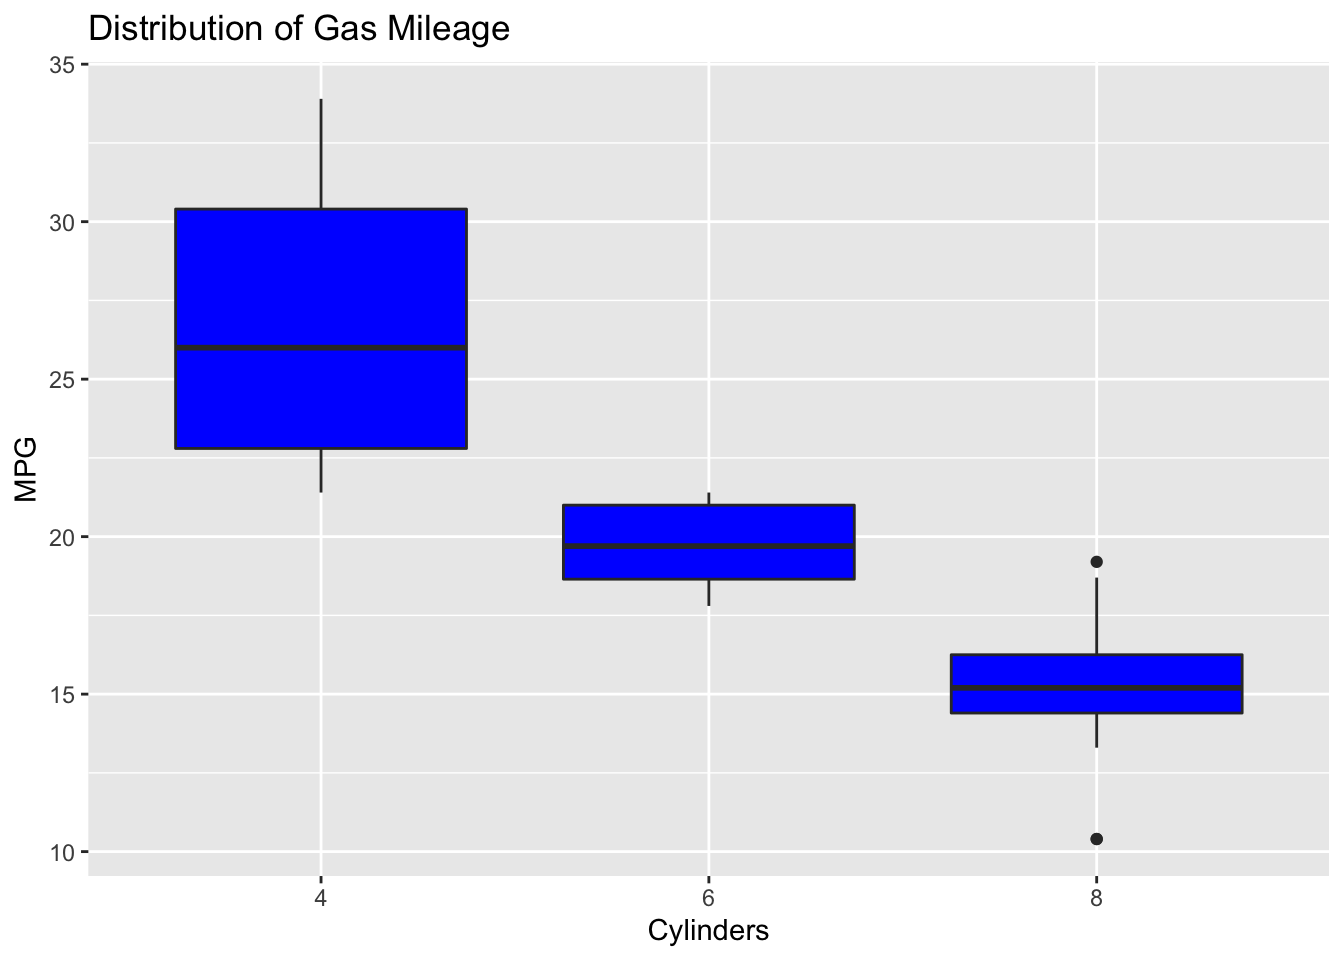
Side By Side Boxplots with Different Colors
You can generate a boxplot with colors that you specify by using the fill argument in geom_boxplot(). There are three boxplots so you should provide three colors. You should only add colors to the plot if they add indicate additional information.
ggplot(data = mtcars, aes(x = factor(cyl), y = mpg)) +
  geom_boxplot(fill = c("blue", "lightblue", "white") ) +
  ggtitle("Distribution of Gas Mileage") +
  ylab("MPG") +
xlab("Cylinders") 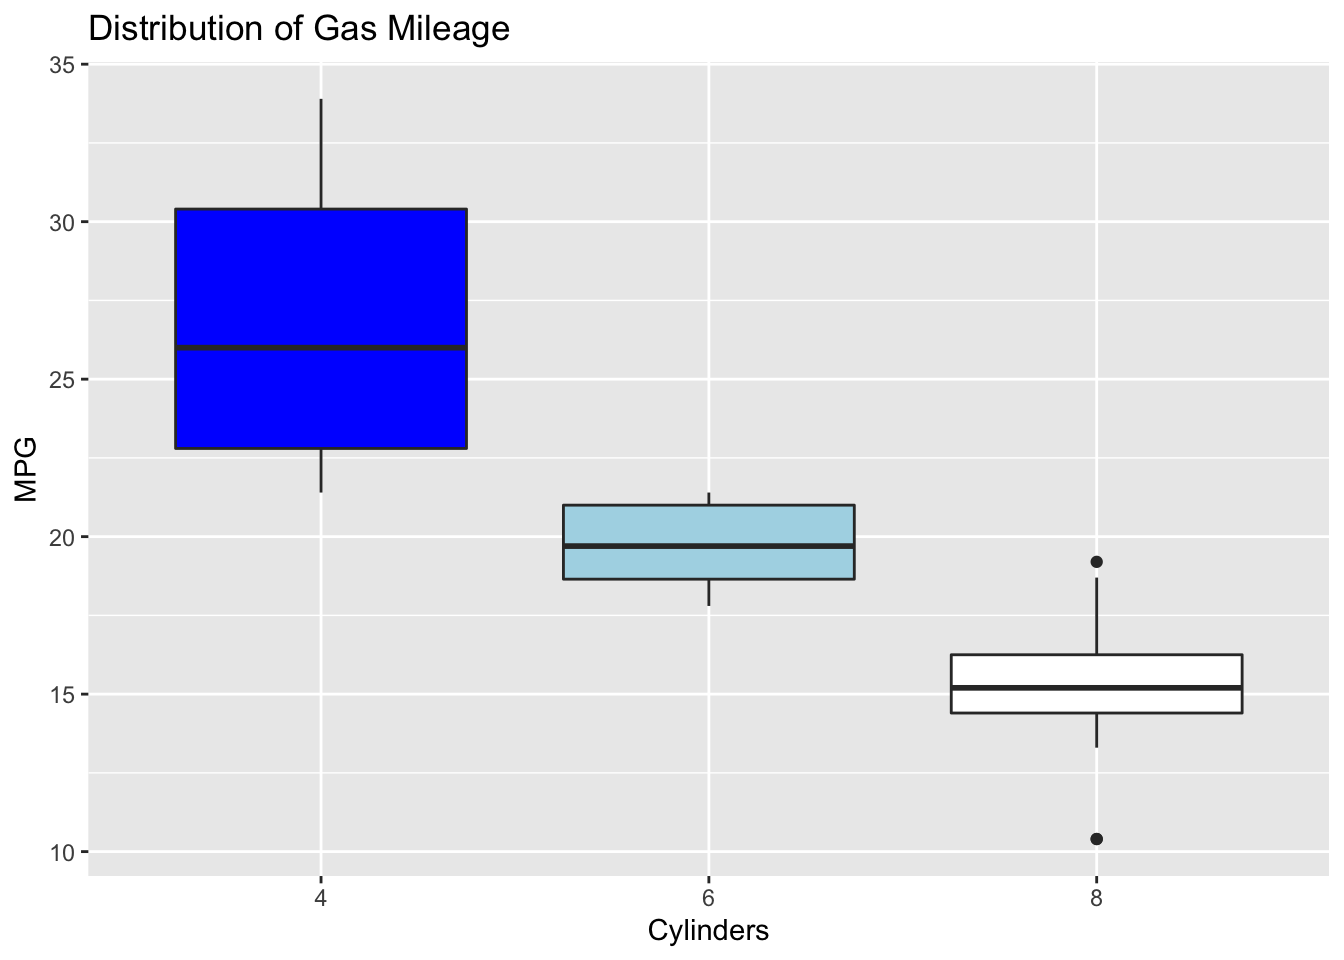
You can also use the fill argument along with a categorical variable inside aes() to create boxplots with colors and a legend.
ggplot(data = mtcars, aes(x = factor(cyl), y = mpg, fill = factor(cyl) ) ) +
  geom_boxplot() +
  ggtitle("Distribution of Gas Mileage") +
  ylab("MPG") +
xlab("Cylinders") 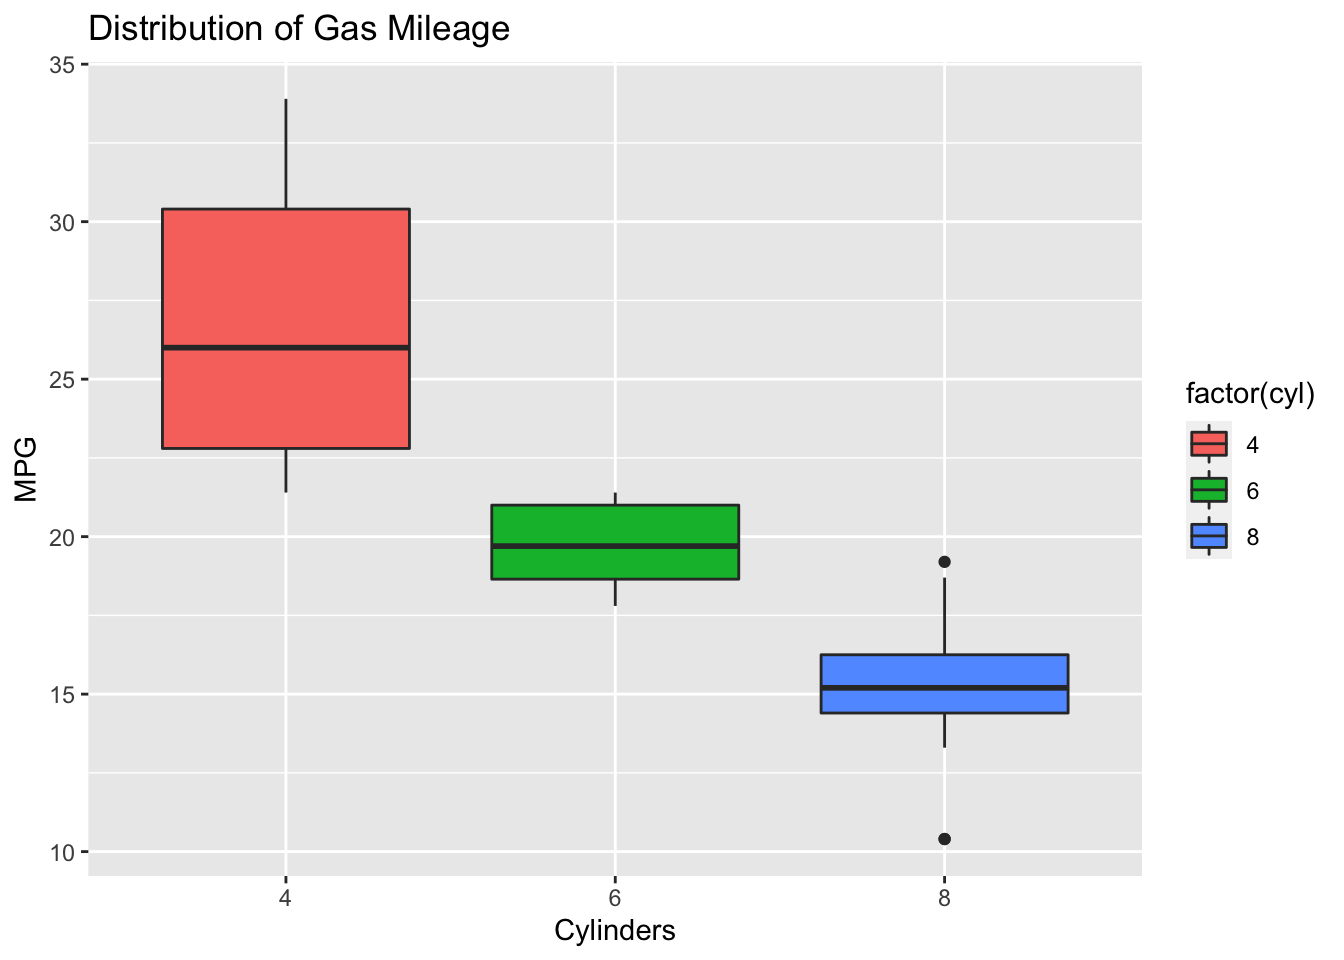
You can suppress the legend by adding show.legend = FALSE in geom_boxlot()
ggplot(data = mtcars, aes(x = factor(cyl), y = mpg, fill = factor(cyl) ) ) +
  geom_boxplot(show.legend = FALSE) +
  ggtitle("Distribution of Gas Mileage") +
  ylab("MPG") +
xlab("Cylinders") 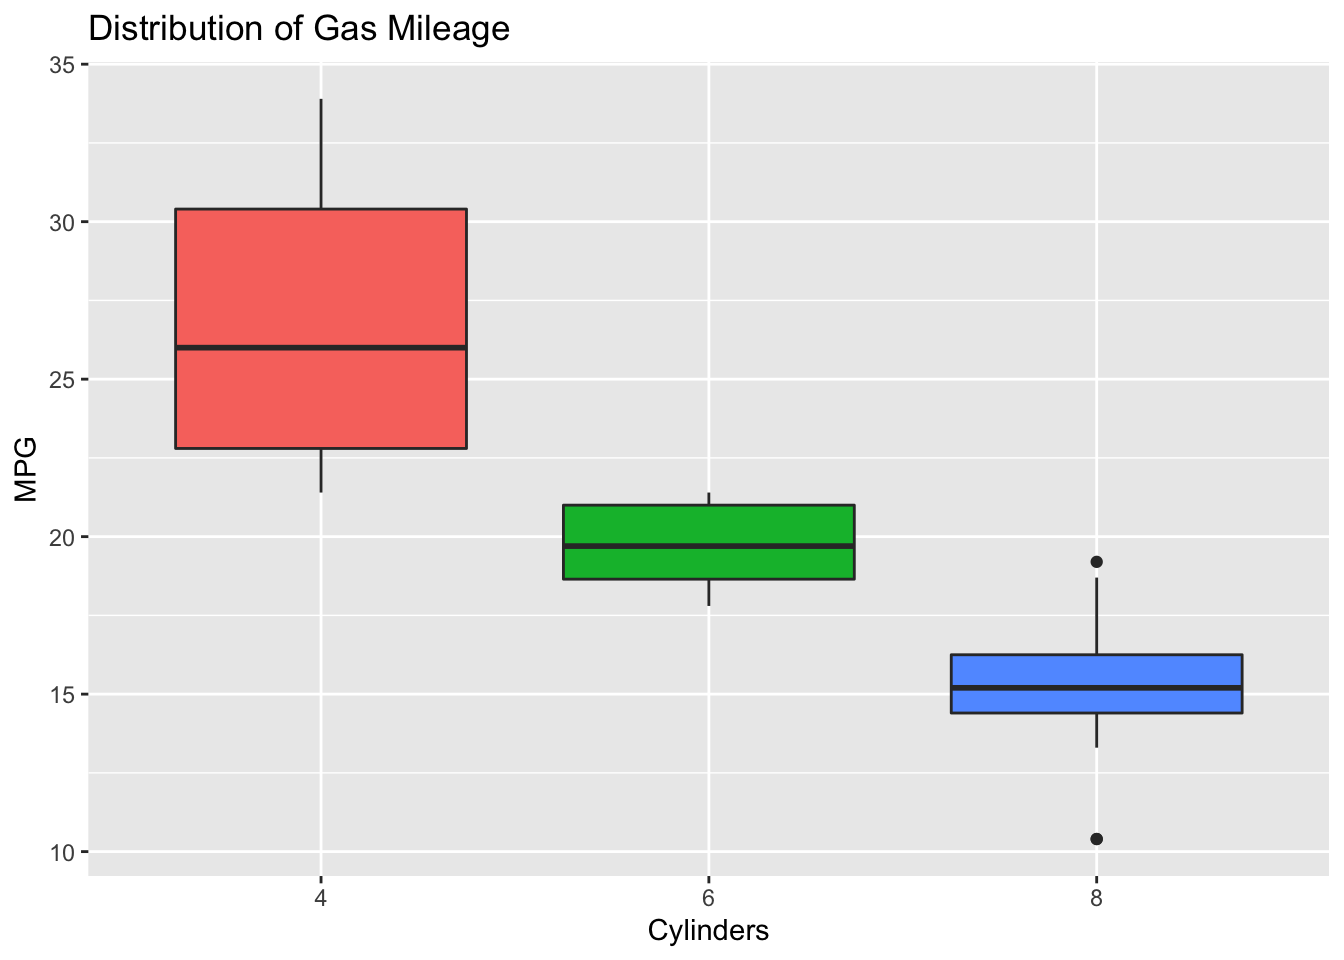
Mathematicss, Computer Science, and Statistics Department Gustavus Adolphus College