Dotplots
Dotplots are used to display the distribution of a single quantitative variable.
Dotplot Using a Dataset
# Data from the cars dataset
stripchart(cars$dist, main="Stopping Distance",at=.1, xlab="Distance (ft)", col="darkgreen", method = "stack", offset = .5, pch=19)
Dotplot Using Your Own Data
Scores <- c(16, 43, 38, 48, 42, 23, 36, 35, 37, 34, 25, 28, 26, 43, 51, 33, 40, 35, 41, 42)
stripchart(Scores, main="Scores Data",at=.1, xlab="Scores", col="blue", method = "stack", offset = .5, pch=19)
Dotplot Using ggplot2
library(ggplot2) #loads the ggplot2 pacakge
dp <- ggplot(data = cars, aes(x = dist)) + geom_dotplot(fill="blue", color="blue") # Creates a Dotplot
dp <- dp + ggtitle("Stopping Distance") +  xlab("Distance (ft") #Adds a title and x-axis label
dp # Displays the plot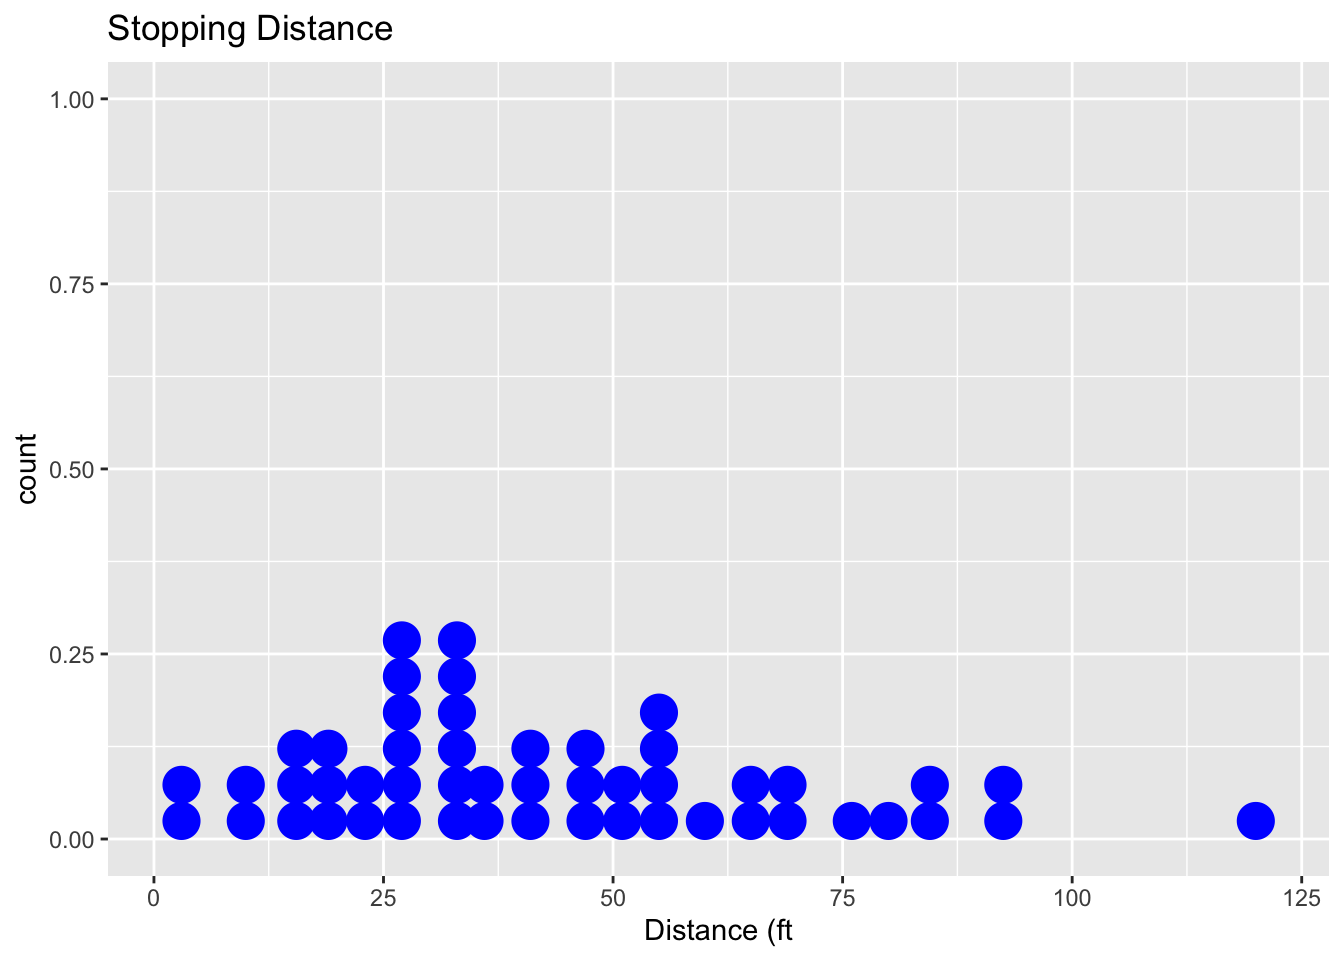
Mathematicss, Computer Science, and Statistics Department Gustavus Adolphus College